A micro-level portrait of Himalayan rural life
Hat Tharp through the lens of the 2011 Census of India — a moderately populated, highly literate community shaped by migration and subsistence agriculture.
The numbers that define us
0
Sex Ratio
females / 1,000 males
0
Households
families
0
Male Population
0
Female Population
0
Children (0–6 yrs)
0
Scheduled Caste
(14.38%)
0
Child Sex Ratio
girls / 1,000 boys
0.00
Male Literacy
%
0.00
Female Literacy
%
Visualising the data
Population by Gender
459 residents · 217 male, 242 female
Sex Ratios vs. State Average
Females per 1,000 males — overall vs. child (0–6)
Literacy Rate Comparison
Effective literacy (7+) vs. Uttarakhand average (78.82%)
Workforce Distribution
Main 56 · Marginal 194 · Non-working 209
Sex Ratios & the Migration Economy
Hat Tharp's overall sex ratio of 1,115 females per 1,000 males vastly exceeds the Uttarakhand average of 963 — but this is the classic footprint of a male out-migration economy, not gender equity. With limited local employment, working-age men migrate to the plains or enlist in the armed forces and paramilitary, leaving a female-dominated resident population that shoulders both domestic and agricultural labour.
The child sex ratio of 758 (25 girls to 33 boys aged 0–6) is far below even the state average — a stark reminder that structural gender inequalities persist across generations.
Human Capital & Literacy
Hat Tharp's effective literacy rate is 91.27% (literates aged 7+), far outpacing Uttarakhand's 78.82% — with male literacy at 97.28% and female at 86.18%. (The crude rate, measured against the entire population, is 79.7%.) This strong human capital is reinforced by an orientation toward military and government service, supported by government Primary, Middle, Secondary and Senior-Secondary schools in and around the village.
A money-order economy
Of 459 residents, 250 (54.5%) are workers — but only 56 are Main Workers (employed ≥6 months/year) while 194 are Marginal Workers, 188 of them marginal cultivators. This is a subsistence, seasonal, fragmented farm economy sustained by remittances — the Himalayan money-order economy.
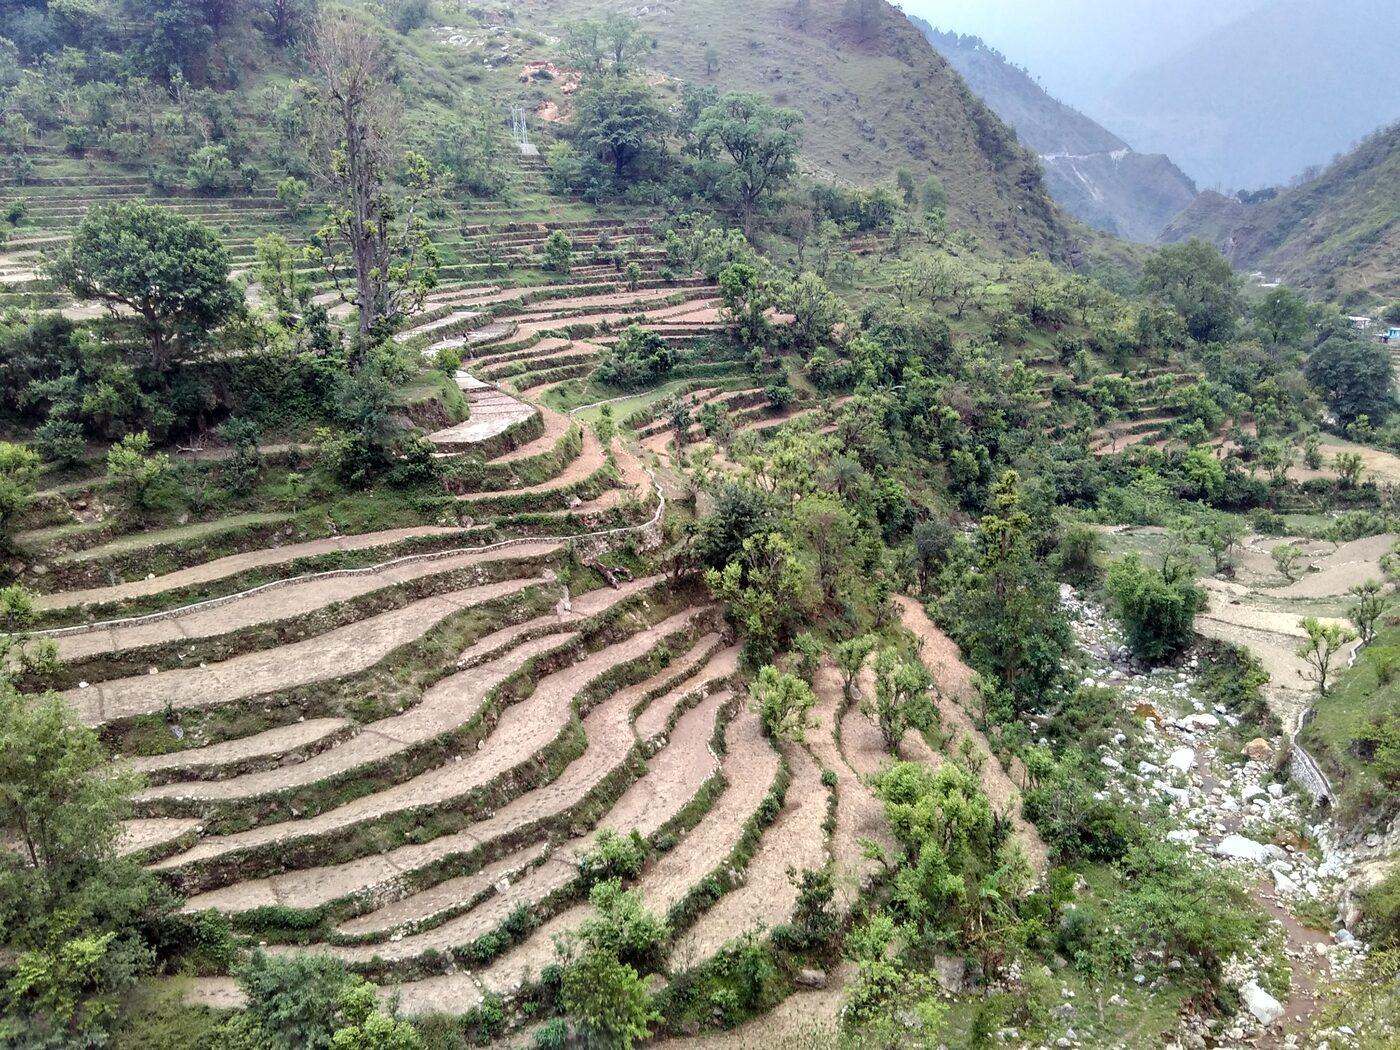
Around 100 farming families work the terraces with drought-resistant indigenous seeds: Paddy, Madua (finger millet), Jau (barley), Gehu (wheat), Bhatt and Kala Bhatt (soybeans).
0
Total Workers
(54.5%)
0
Main Workers
(≥6 months/yr)
0
Marginal Workers
(<6 months/yr)
Indicative Crop Mix
Diversified, drought-resistant indigenous seeds grown on the terraces.
Demographics & economy — FAQs
Census-backed answers on population, literacy, the sex ratio and the village's migration-shaped economy.
What is the population of Hat Tharp village?
459 people at the 2011 Census — 217 male and 242 female — living in 114 households, including 58 children aged 0–6.
What is the literacy rate in Hat Tharp?
91.27% overall, well above the national average — 97.28% for men and 86.18% for women.
What is the sex ratio?
1,115 females per 1,000 males, far above the national average, reflecting long-standing male out-migration for work. The child sex ratio is 758.
What work do residents do?
Of about 250 workers, most are cultivators on terraced farms — 56 main workers and 194 marginal workers — supported by remittances in what is often called a 'money-order economy'.
What is the social composition?
Scheduled Castes make up 66 residents (14.38%); the village records no Scheduled Tribe population in the 2011 Census.
Why is migration so significant for the village?
Limited local employment has long sent men to the plains and the armed forces, leaving women to sustain the farms and households — a defining feature of the village's economy and resilience.